An image of an annulus, square annulus, double slit, square and 2 dots was created using Microsoft Paint. The Fourier Transform of the images were then computed using the fft function of Scilab. The Scilab code to generate the Fourier Transform is:
S=gray_imread('Sq.bmp');
SA=gray_imread('SqA.bmp');
C=gray_imread('CircleA.bmp');
SL=gray_imread('Slit.bmp');
D=gray_imread('2dots.bmp');
imshow(abs(fftshift(fft2(D))), []);
(Note: The image generated in this sample code is the diffraction pattern of the 2 dots aperture)
The created images and their corresponding transformed images are shown below. SA=gray_imread('SqA.bmp');
C=gray_imread('CircleA.bmp');
SL=gray_imread('Slit.bmp');
D=gray_imread('2dots.bmp');
imshow(abs(fftshift(fft2(D))), []);
(Note: The image generated in this sample code is the diffraction pattern of the 2 dots aperture)


The images on the left act as the aperture and the images, the Fourier Transform, on the right displays the diffraction pattern of the respective apertures.
B. Anamorphic Property of Fourier Transform
A sinusoidal wave was created in Scilab. The Fourier Transform and the image of the wave was then generated for different wave frequencies. A rotated sine wave was then generated. The Fourier Transform and the image of the transform was also computed and generated for different frequencies using Scilab. The sample Scilab code is shown below:
nx=100;
ny=100;
x=linspace(-1,1,nx);
y=linspace(-1,1,ny);
[X,Y]= ndgrid(x,y);
f=1;
z=sin(2*%pi*f*X);
wave=abs(fftshift(fft2(z)));
scf(1);
imshow(wave,[]);
scf(2);
mesh(wave);
scf(3);
imshow(z,[]);
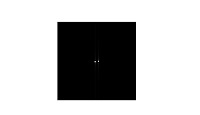
The image of the wave, the transformed wave, and the 3D plot of the wave is shown below.


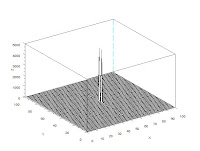
For f=2


For f=3


The distance between the white spots in the transformed image widens as the frequency of the wave increases. The sinusoidal wave was then rotated 30 degrees. The wave was tested for different frequencies. The wave, the Fourier Transform and the 3D plot of the wave is shown below. The Scilab code used to generate the images below is the same as the code given for part b except that a different expression for z was used and a angle component was added. (In this case, z=sin(2*%pi*f*(Y*sin(theta) + X*cos(theta)))).
For f=1

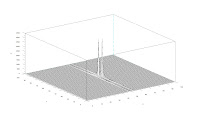
For f=2


For f=3


For theta=45 degrees


I will give myself 10/10 for this completing this activity.
**Special thanks to Raffy and Gilbert for tips during the activity.
nx=100;
ny=100;
x=linspace(-1,1,nx);
y=linspace(-1,1,ny);
[X,Y]= ndgrid(x,y);
f=1;
z=sin(2*%pi*f*X);
wave=abs(fftshift(fft2(z)));
scf(1);
imshow(wave,[]);
scf(2);
mesh(wave);
scf(3);
imshow(z,[]);
The image of the wave, the transformed wave, and the 3D plot of the wave is shown below.
For f=1


For f=2


For f=3


The distance between the white spots in the transformed image widens as the frequency of the wave increases. The sinusoidal wave was then rotated 30 degrees. The wave was tested for different frequencies. The wave, the Fourier Transform and the 3D plot of the wave is shown below. The Scilab code used to generate the images below is the same as the code given for part b except that a different expression for z was used and a angle component was added. (In this case, z=sin(2*%pi*f*(Y*sin(theta) + X*cos(theta)))).
For f=1


For f=2


For f=3


The wave appearance when theta is equal to 60 is shown in the images below. The frequency of the wave is 1.


The shift in the direction of the wave is clearly observed when the angle used was shifted from 30 to 60 degrees. A pattern was then generated using two sinusoidal waves. The wave was rotated to a certain angle. The images of the wave are shown below. The expression for z in this case is given by:
z=sin(2*%pi*4*X).*sin(2*%pi*4*Y) + sin(2*%pi*f*(Y*sin(theta) + X*cos(theta)))
For theta=30 degrees


z=sin(2*%pi*4*X).*sin(2*%pi*4*Y) + sin(2*%pi*f*(Y*sin(theta) + X*cos(theta)))
For theta=30 degrees


For theta=45 degrees


I will give myself 10/10 for this completing this activity.
**Special thanks to Raffy and Gilbert for tips during the activity.


No comments:
Post a Comment