Wednesday, July 29, 2009

Activity 11. Color Camera Processing

Images of objects were taken using different white balance level. The images were taken using the camera of a Samsung cellular phone ith maximum resolution of 3MP. The image with the worst white balance was loaded and enhanced in Scilab using two methods: the white patch method and the gray world method.


(Left to right: Auto, Daylight, Cloudy, Incandescent, Flourescent and Sunset White balance)

The image taken using the sunset white balance was chosen as the image to be enhanced. A white patch from the image was chosen in order to execute the white patch enhancement method. The patch used in enhancing the image is shown below.


The patch itself is no longer white due to the poor white balancing. The white patch method was then applied to the image along with the gray world method of image enhancement. The resulting images are presented below.


(Original, Gray world and White patch)

From the previous set of images, it can be seen that the gray world method produced a clearer enhanced image than the white patch method but the enhanced image produced using the white patch reproduced colors close to the colors of the objects. Three images (each image containing only 1 primary color) were taken and enhanced using the white patch and the gray world image.

A. Red


(Above: Patch; Left to right: Original, White Patch, and Gray World)

B. Green


(Above: Patch; Left to right: Original, White Patch, and Gray World)

C. Blue


(Above: Patch; Left to right: Original, White Patch, and Gray World)

From the three sets of images, it can be concluded that the white patch method can enhance the image better than the gray world method. The white patch method produced an enhanced image that is close to the image of the original object taken with good white balancing.

I will give myself 10/10 for this activity.

** Tips and ideas from Gilbert were useful in this activity.


Tuesday, July 28, 2009

Activity 10. Preprocessing Text

A preselected image was processed using Scilab. A portion of the image containing a handwritten text was selected and read using Scilab. The image was then converted into a grayscale image and was tilted using the im2gray and mogrify command, respectively. The image was then enhanced using a filter. The original image, filter and the enhanced image are shown below.


The image was then binarized and inverted. The resulting image is shown below.


The image was then further enhanced using dilate and erode command in Scilab. The enhanced image is shown below.

Comparing the two previous images it can be seen that most of the black lines were removed in the latter image. It can also be observed that the characters are thicker than the first enhanced image. Using bwlabel in Scilab, it was found out that 38 clusters were formed in the last enhanced image. The number of cluster in the enhanced image is close to the number of clusters in the original image.

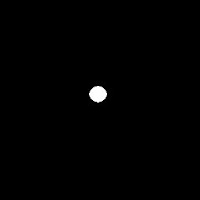
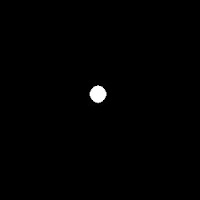
The image of the receipt was then loaded into Scilab. The image was then converted to binary image. The word 'DESCRIPTION' was then cut out from the image and another image was generated with thw word 'DESCRIPTION' at the center of the image. The newly generated image was then correlated with the image of the receipt. The results are shown below.


Three bright points on the correlated image were observed. The bright spots are where the word "DESCRIPTION" is located at the original image.

I will give myself 10/10 for accomplishing the tasks in this activity

**Tips from Gilbert helped a lot.

Activity 9. Binary Operations

The main objective of this activity is to measure the area of the hole in an image with the help of different enhancement techniques. The activity started by selecting an image of a paper with holes. Nine representative, 256x256 images were taken from the original image. The original image is shown below along with one of the representative image.


The representative images were then converted to binary images and enhanced(using dilate and erode) to make the holes clearer. The binary image and the enhanced binary image are shown below.
(Binary and Enhanced Binary Image)

The area of each blob or hole was then computed from the enhanced binary image with the help of the bwlabel function in Scilab. This was done for each representative image. The computed areas were then listed and used to generate the histogram of the area versus frequency. The histogram is shown below.


High area frequency is found in the computed areas ranging from 5o0 to 550. The mean area was computed and was found out to be equal to 519.35849. The standard deviation was also computed and was found out to be equal to 8.4446031. The theoretical area was then computed using the image of a single circle. The theoretical area is equal to 517. Using the theoretical and the mean area, the percent error of the computed area was found out to be equal to 0.456%. The single circle and the binarized image of the single circle is shown below.


I will give myself 10/10 for this activity.

**Neil and Gilbert gave useful tips in solving for the areas of the circles.


Activity 8. Morphological Operations

Images containing different shapes were created using the Microsoft Paint. Using Scilab, the images were processed using different structural elements. The created images were a 50x50px square, a circle with 25px radius, a triangle with height equal to 30px and base equal to 50px, a 60x60px hollow square with 4px thick edges, and a plus sign with thickness equal to 8px and line length equal to 50px. The structural elements used are matrices with 4x4 ones, 2x4 ones, 4x2 ones and a cross 5px long and 1px thick. The created images are shown below. The images were processed using the erode and dilate function in Scilab. The outcome or appearance of the images after undergoing erode and dilate were first predicted before using Scilab. The following images were generated using dilate and 4x4, 2x4, 4x2 and cross structuring element, respectively. The first images in each set are the original images followed by the images generated using the structuring elements following the order stated above.


A. Square


B. Triangle


C. Circle


D. Hollow Square


E. Plus

Using Erode and 4x4, 2x4, 4x2 and cross structuring elements, the following images were generated. Each set of images follow the same order as the images above.

A. Square


B. Triangle


C. Circle


D. Hollow Square


E. Plus


The shape of the generated images are the same as the predicted images. The shapes' sizes agree with the predictions with only a small deviation.