
Wednesday, September 23, 2009

Activity 19. Restoration of Blurred Image

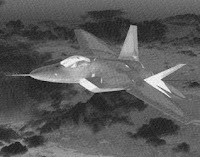
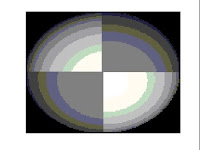
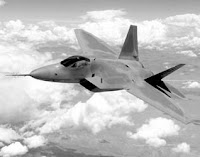
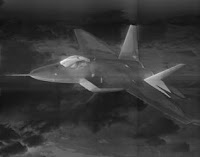
A grayscale image were selected and processed using Scilab. Noise(Gaussian) was then introduced to the image. The parameter a, b and T was varied to see the their effects to the degraded image. The degraded images are shown in Figure 1.


Figure1. Original and Degraded images(a=b=0.001, a=b=0.1 and a=b=0.01)

From the images in figure 1, it can be seen that the amount of blurring increases as the value of a and b increases.

The degraded image were then subjected to Weiner Filtering. The resulting images are shown below.

For a=b=0.1 and T=1:


Figure2. Filtered images(K=0.0001 and K=0.001)

For a=b=0.01 and K=0.0001:


Figure3. Filtered images(T=10 and T=1000)

It can be observed from Figures 2 and 3 that as the value of parameter T increases the enhanced image becomes sharper. The opposite behaviour is observed for the parameter K. As K increases, the image becomes more blurred and degraded.


In summary, a grayscale image was degraded using gaussian noise. The degraded image was then subjected to Weiner filtering. The parameters of the noise and filter were varied to observe its effect to the enhanced image. It was observed that as the value of a and b decreases, degradation of the image becomes lesser. It was also observed that the enhanced image becomes clearer and sharper when the parameter T is increased and the parameter K is decreased. It can therefore be recommended that a low value of K and a high value of T be used in enhancing a degraded image.

I will give myself 10/10 in this activity.

*** My thanks to Rommel for helping me in this activity.

Wednesday, September 16, 2009

Activity 18. Noise Model and Basic Image Restoration

An image with 3 different levels of grayscale values was processed using Scilab. Different kinds of noise were introduced to the image. The PDF of the original image and the image with noise was generated. The original image and the image with noise are shown in Figure 1. It can be seen that the amount of distortion in the image varies with the kind of noise introduced to the original image.


Figure1. Original image and images with different noise(from the left: Original, Exponential, Gamma, Gaussian, Salt and Pepper, Uniform Function and Rayleigh)

The PDF of the original image and the images with noise is shown in Figure 2. The PDF exhibits 3 peaks due to the different gray levels of the selected image.


Figure2. PDF of the original image and images with Noise((from the left: Original, Gaussian, Gamma, Exponential, Salt and Pepper and Uniform Function)


The image with noise was then enhanced using different filters. The image with gaussian noise were then subjected to different filters. The resulting images are shown in Figure 3.


Figure3. Enhanced images using different filters(Arithmetic, Contraharmonic, Geometric and Harmonic Mean Filter)
For the image with exponential noise:

Figure4. Enhanced images using different filters(Arithmetic, Contraharmonic, Geometric and Harmonic Mean Filter)

For the image with gamma noise:


Figure5. Enhanced images using different filters(Arithmetic, Contraharmonic, Geometric and Harmonic Mean Filter)


For the image with salt and pepper noise:

Figure6. Enhanced images using different filters(Arithmetic, Contraharmonic, Geometric and Harmonic Mean Filter)

For the image with uniform noise:

Figure7. Enhanced images using different filters(Arithmetic, Contraharmonic, Geometric and Harmonic Mean Filter)


For the image with Rayleigh noise:

Figure8. Enhanced images using different filters(Arithmetic, Contraharmonic, Geometric and Harmonic Mean Filter)


A grayscale image was then selected. The selected image were then subjected with different kinds of noise. The resulting images are shown in figure 9.


Figure9. Original image and images with different noise(from the left: Original, Exponential, Gamma, Gaussian, Salt and Pepper, Uniform Function and Rayleigh)

The generated images with noises were then subjected to different filters. For the image with gaussian noise:


Figure10. Enhanced images using different filters(Arithmetic, Contraharmonic, Geometric and Harmonic Mean Filter)

For the image with Gamma noise:

Figure11. Enhanced images using different filters(Arithmetic, Contraharmonic, Geometric and Harmonic Mean Filter)
For the image with Rayleigh noise:
Figure12. Enhanced images using different filters(Arithmetic, Contraharmonic, Geometric and Harmonic Mean Filter)
For the image with Salt and Pepper noise:
Figure13. Enhanced images using different filters(Arithmetic, Contraharmonic, Geometric and Harmonic Mean Filter)
For the image with Exponential noise:
Figure14. Enhanced images using different filters(Arithmetic, Contraharmonic, Geometric and Harmonic Mean Filter)
For the image with Uniform noise:
Figure15. Enhanced images using different filters(Arithmetic, Contraharmonic, Geometric and Harmonic Mean Filter)


In summary, different kinds of noise were introduced to a selected image. The images with noise were generated using some Scilab functions. Built-in filters in Scilab were then used to enhanced the noise containing image. From the generated filtered images, it was observed that there is no universal filter that can produce the best image for all kinds of noises. A certain filter is suited for a certain noise.

I will grade myself 10/10 for completing this activity.

***Earl helped a lot in formulating the Scilab code used in this activity.

Wednesday, September 9, 2009

Activity 17. Photometric Stereo

In this activity, the an object was recreated using photometric stereo in Scilab.

The images of an object illuminated by a light source located from four different locations were used in this activity. The images and the locations of the light source are shown below.


Figure1. Images rendered in Matlab


Figure2. Locations of Light Sources


The images from a Matlab file ('photos.mat') was loaded in Scilab using the Scilab command loadmatfile. The surface normal(n) of the images were then computed in Scilab using the equations given below.


where:


After the surface normals were computed, the elevation z was then computed using the following equations:


The integral function in the given equations was evaluated using the cumsum function in Scilab. The computed elevation was then used to generate the 3D plot of the object. The generated plot is shown below.


Figure3. 3D plot of the object

I will give myself 10/10 for completing this activity.


Sunday, September 6, 2009

Activity 16. Neural Networks

In this activity, objects were classified using neural networks. Only two types and two features were used for this activity. The two types of bottle caps(Coke and Sprite) were used as samples to test the efficiency of neural networks as classifiers. The coke bottle caps were tagged with the value of 1 while the sprite bottle caps were given the value of 0. The training set used to train the neural network is given below. The first column is the area of the object while the second column is the color level of the object.

x=[0.929186603, 0.58557;
0.653588517, 0.147957;
0.908133971, 0.615335;
0.579904306, 0.145402;
0.655502392, 0.164236;
0.956937799, 0.630004;
0.902392344, 0.638101;
0.679425837, 0.14559;
0.650717703, 0.15673;
0.677511962, 0.140274;
0.968421053, 0.618755;
0.914832536, 0.635996;
0.742583732, 0.147524;
0.96937799, 0.62855;
0.923444976, 0.642857;
0.717703349, 0.135958;
0.800956938, 0.157814;
1, 0.613532;
0.983732057, 0.668547;
0.7215311, 0.137754;];

The first column was normalized in order for the maximum area calculated will be equal to 1. Using the provided source code(from Cole Fabros' work), the objects were classified using neural networks in Scilab. The source code is provided below.

rand('seed',0);
N=[2,2,1];

x=[0.929186603, 0.58557;0.653588517,0.147957;0.908133971, 0.615335;0.579904306, 0.145402;0.655502392, 0.164236;0.956937799, 0.630004;0.902392344, 0.638101;0.679425837, 0.14559;0.650717703, 0.15673;0.677511962, 0.140274;0.968421053, 0.618755;0.914832536, 0.635996;0.742583732, 0.147524;0.96937799, 0.62855;0.923444976, 0.642857;0.717703349, 0.135958;0.800956938, 0.157814;1, 0.613532;0.983732057, 0.668547;0.7215311, 0.137754;];

x1=x';
t=[0 1 0 1 1 0 0 1 1 1 0 0 1 0 0 1 1 0 0 1 ];
l=[0.1,0];
W=ann_FF_init(N);

T=1000;

W=ann_FF_Std_online(x1,t,N,W,l,T);

A=ann_FF_run(x1,N,W);

The output values of the program is shown below.

A=[0.0698714 0.9559284 0.0604605 0.9617354 0.9494504 0.0532122 0.0541484

0.9547831 0.952926 0.9568003 0.0555345 0.0539992 0.9485505 0.0529052

0.0518202 0.9552809 0.9369444 0.0551047 0.0441003 0.9543265]

The values in A were then rounded off. The resulting values are the same with the target values t given in the source code above. This means that the objects were successfully classified using neural networks. This result is for N=[2,2,1].

round(A)=[ 0. 1. 0. 1. 1. 0. 0. 1. 1. 1. 0. 0. 1. 0. 0. 1. 1. 0. 0. 1.]

For N=[2,5,1],

A=[ 0.0550852 0.9665592 0.0434460 0.9728303 0.9595599 0.0347047 0.0358142

0.9653303 0.9633175 0.9674942 0.0375346 0.0356348 0.9586883 0.0343439

0.0330257 0.9658597 0.9464930 0.0370670 0.0238807 0.9648412]

round(A)=[ 0. 1. 0. 1. 1. 0. 0. 1. 1. 1. 0. 0. 1. 0. 0. 1. 1. 0. 0. 1.]


If the learning rate was changed to a higher value the output A changes. The result is given below.

A=[ 0.0156586 0.9922242 0.0111422 0.9941406 0.9898376 0.0081610 0.0085014

0.9918369 0.9911437 0.9925391 0.0091049 0.0084479 0.9895962 0.0080486

0.0076092 0.9920324 0.9849933 0.0089606 0.0049144 0.9916999 ]

This result was calculated when the learning rate is 0.9. Comparing the values of A when the learning rate is 0.1 and when the learning rate is 0.9, it can be observed that the values of A are nearer to the target values when the learning rate is 0.9. These means that a higher learning rate produces a more accurate result.

I will give myself 10/10 for getting accurate results.

Activity 15. Probabilistic Classification

The goal of this activity is to classify 20 objects according to their classes.

The objects used in this activity are 10 Coke and 10 Sprite bottle caps. The image of the objects were taken and converted into a binary image using Scilab. The original image and the binary image are shown in Figure 1.


Figure1. Original and Binary image of the previous image


The objects were then classified using the same method employed on activity 14. The plot showing the classification of the samples used is shown in Figure 2.

Figure2. Classification of Objects

As seen in Figure 2, the classification of the samples is well separated. Linear Discriminant Analysis(LDA) was then used to further classify the samples. The plot of the classification using LDA is shown in Figure 3. A line separating the 2 groups was drawn to show the boundary between the two groups of samples. The separation between the two groups is small but is sufficient to show the classification of each sample.


Figure3. LDA

For completing this activity successfully, I will give myself 10/10.

***Earl tips helped a lot.

Monday, August 24, 2009

Activity 14. Pattern Recognition

The goal of this activity is to classify the chosen samples to their respective classes (such as color and size) using Scilab.

Objects with different characteristics were chosen as samples for this activity. In this case, 10 pieces of 2 kinds of soft drink caps and 10 pieces of 25 centavo coins were chosen. The image of the samples were taken and then processed using Scilab. Five samples for each type of object was chosen as the basis of each types color level and size. The image containing 5 samples of each type were converted into a binary image using the im2bw function in Scilab. The sizes of the samples were then computed with the help of the bwlabel function. The mean of the sizes of the different objects were then computed. The color level of each of type of object in the image containing 5 of each type of object were computed. The mean color level (Red channel) and the mean size or area was then compared to the sizes and color levels of the objects in the image containing 10 of each objects.

The original image of the samples along with the binary image is shown below.


Figure1. Sample Objects

The generated classification graph is shown in Figure 2.

Figure2. Sample Groupings

Figure 2 shows the classification plot of the chosen samples. The x-marks represents the samples while the colored dots represent the basis or the supposed group position. The x-axis position of the group of red caps should be aligned with the position of the group of white caps since they have the same area. This is due to the enlargement of the area of the white caps when the image was converted into a binary image. The areas of the red caps seem to vary more compared to the areas of the other groups.


I give myself 10/10 in this activity.

Monday, August 17, 2009

Activity 13. Correcting Geometric Distortions


An image of a grid line was downloaded from the internet. The image of the grid line exhibited distortion. The dimension of the portion of the grid with no distortion were taken and used to compute and generate the ideal grid. The distorted image is shown in Figure 1.


Figure1. Distorted image

Now, the ideal vertex points can be derived from the distorted image considering Figure 2 and the following equations.

Figure2. Distorted and ideal image


Using the diagram, given equations and the vertices of the distorted image, the ideal grid vertex points were generated using Scilab. The vertices was obtained using the locate function in Scilab. The ideal grid points are shown in Figure 3.


Figure3. Ideal vertex points

The ideal grid was then generated using two methods: the nearest neighbor technique and the bilinear interpolation. The equations shown below were used in generating the ideal grid or image.


The ideal images generated using the two techniques are shown in Figure 4 and Figure 5.


Figure4. Bilinear Interpolation


Figure5. Nearest Neighbor Technique

As seen in the presented images, there is only a slight change on the distorted image after subjecting it to bilinear interpolation and nearest neighbor technique. There are only subtle differences between the images generated using the two techniques but, as expected, the image generated using bilinear interpolation exhibits a less distorted image than the image generated using the other technique. The lines in the image produced using bilinear interpolation is straighter and the gaps between squares are more uniform compared to the lines and spacing of the image generated using the nearest neighbor technique.

In summary, a distorted image was fixed using two different techniques: the bilinear interpolation and nearest neighbor technique. The results showed that the ideal image generated using bilinear interpolation is better than the image generated using nearest neighbor technique.


I will give myself 9/10 for this activity.

***Gilbert helped a lot in fixing the source code for this activity.